View the Captivate® Reporting Data Sheet
Captivate® Reporting provides turn-key reports that show your study progress in real-time and allow you to drill down on the data that matters.
Key Features:
-

Save Time
- Pre-built industry-standard reports with vital actionable data
-

Self-service
- Designate specific reports to various study roles
-

Real-time
- Provides users up-to-date reports instantly
-

Embedded
- Users can access the tools from within the Captivate® Live Application
Industry-standard reports
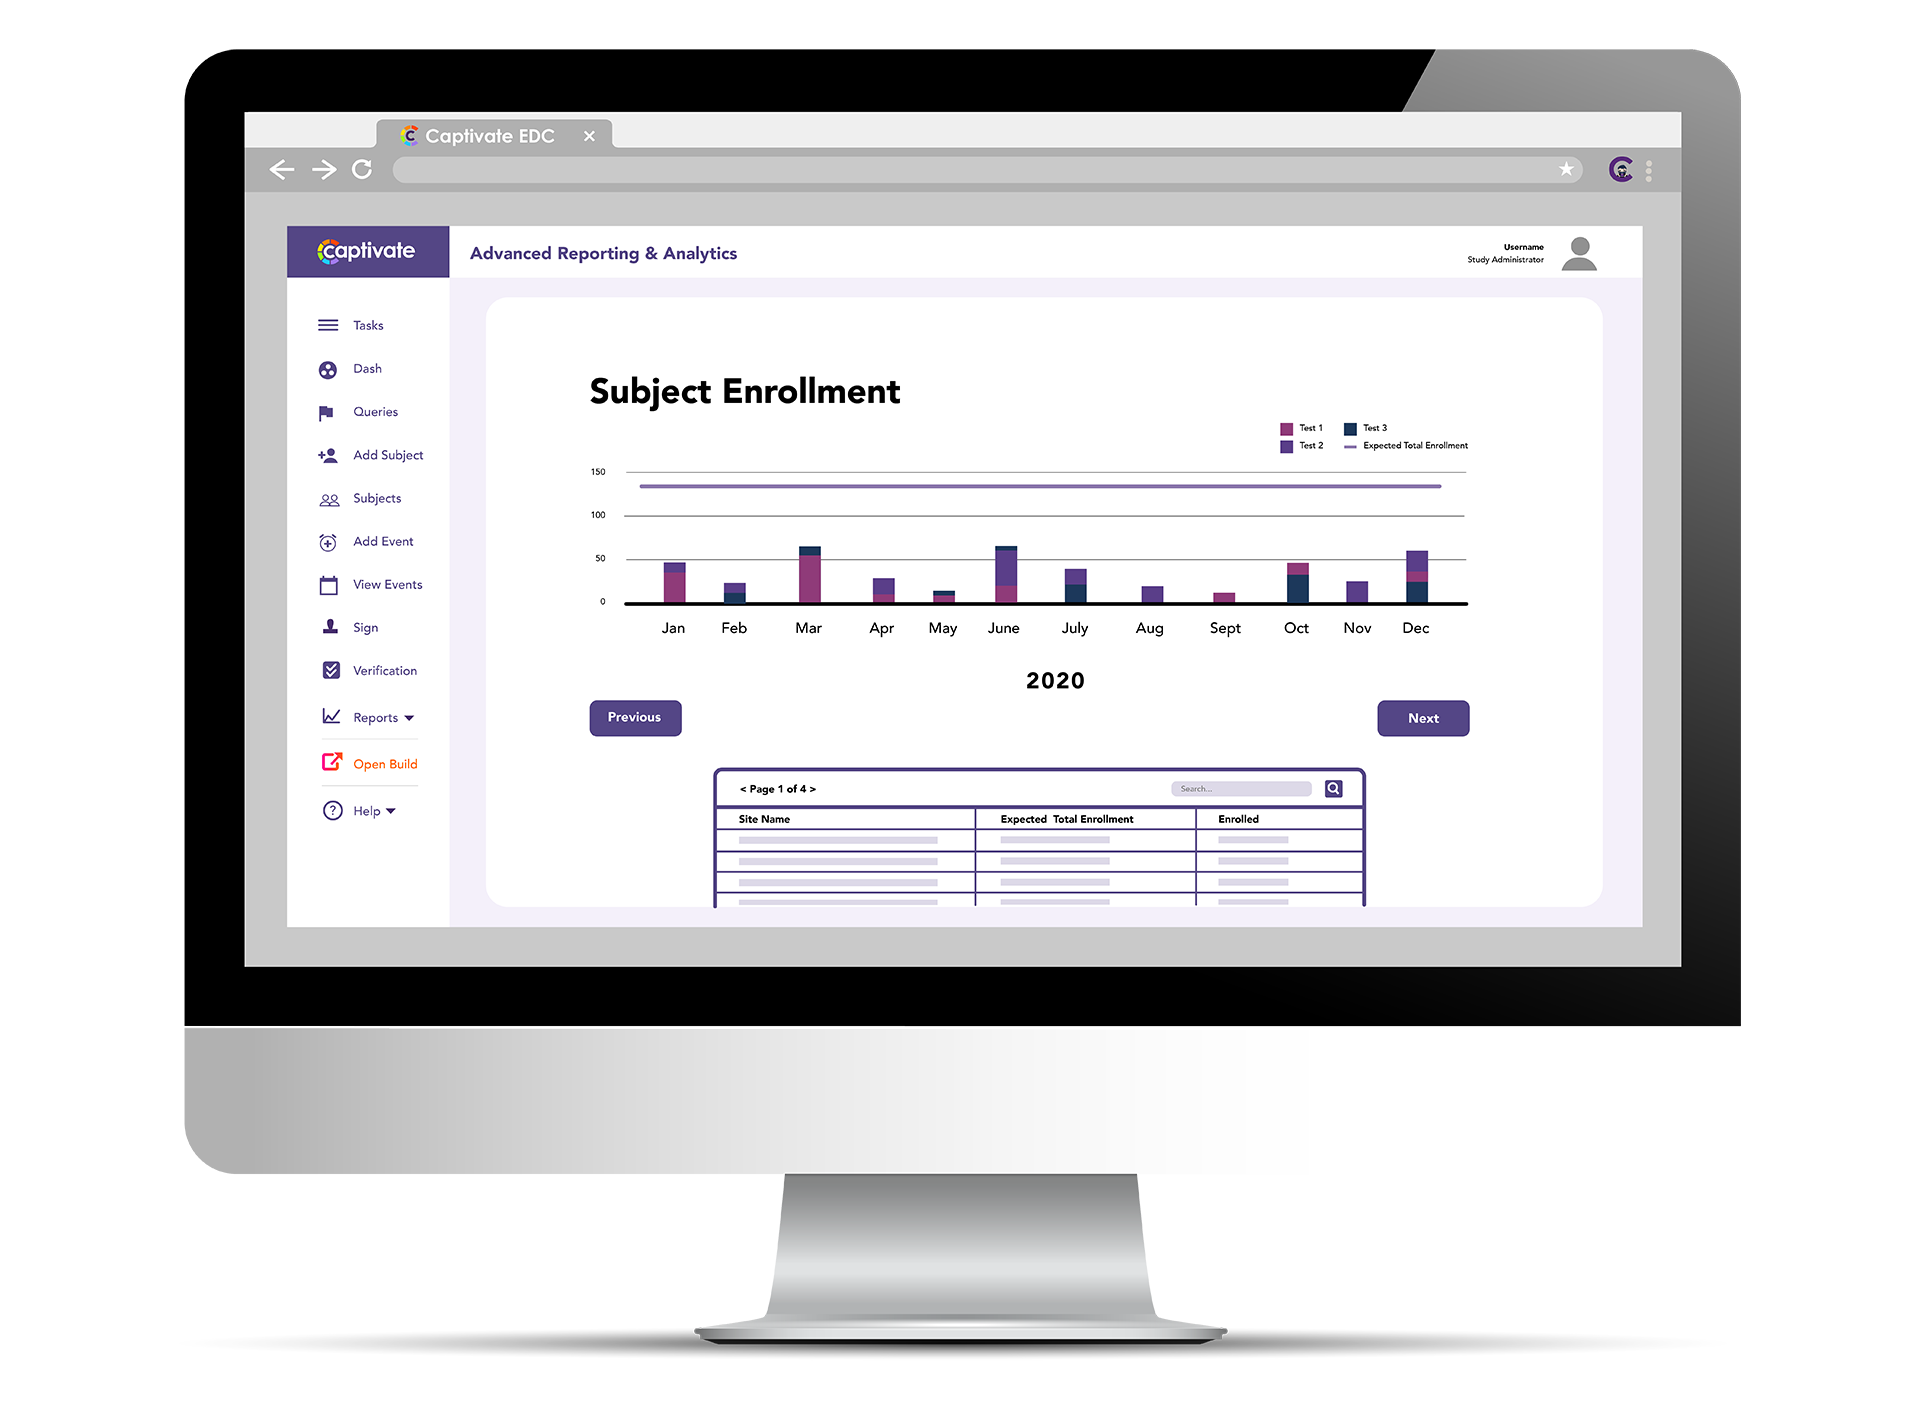
Study Progress
Subject enrollment- Track subject enrollment
- View target, projected, and actual trends
- Analyze status of queries by site
- View completion percentage for individual or all queries
- By site, look at status of queries
Subject status
- Track each subject's progression in a study
- View distribution of subjects by status and/or site
Form completion
- Monitor form progress
- View upcoming, missing and completed forms
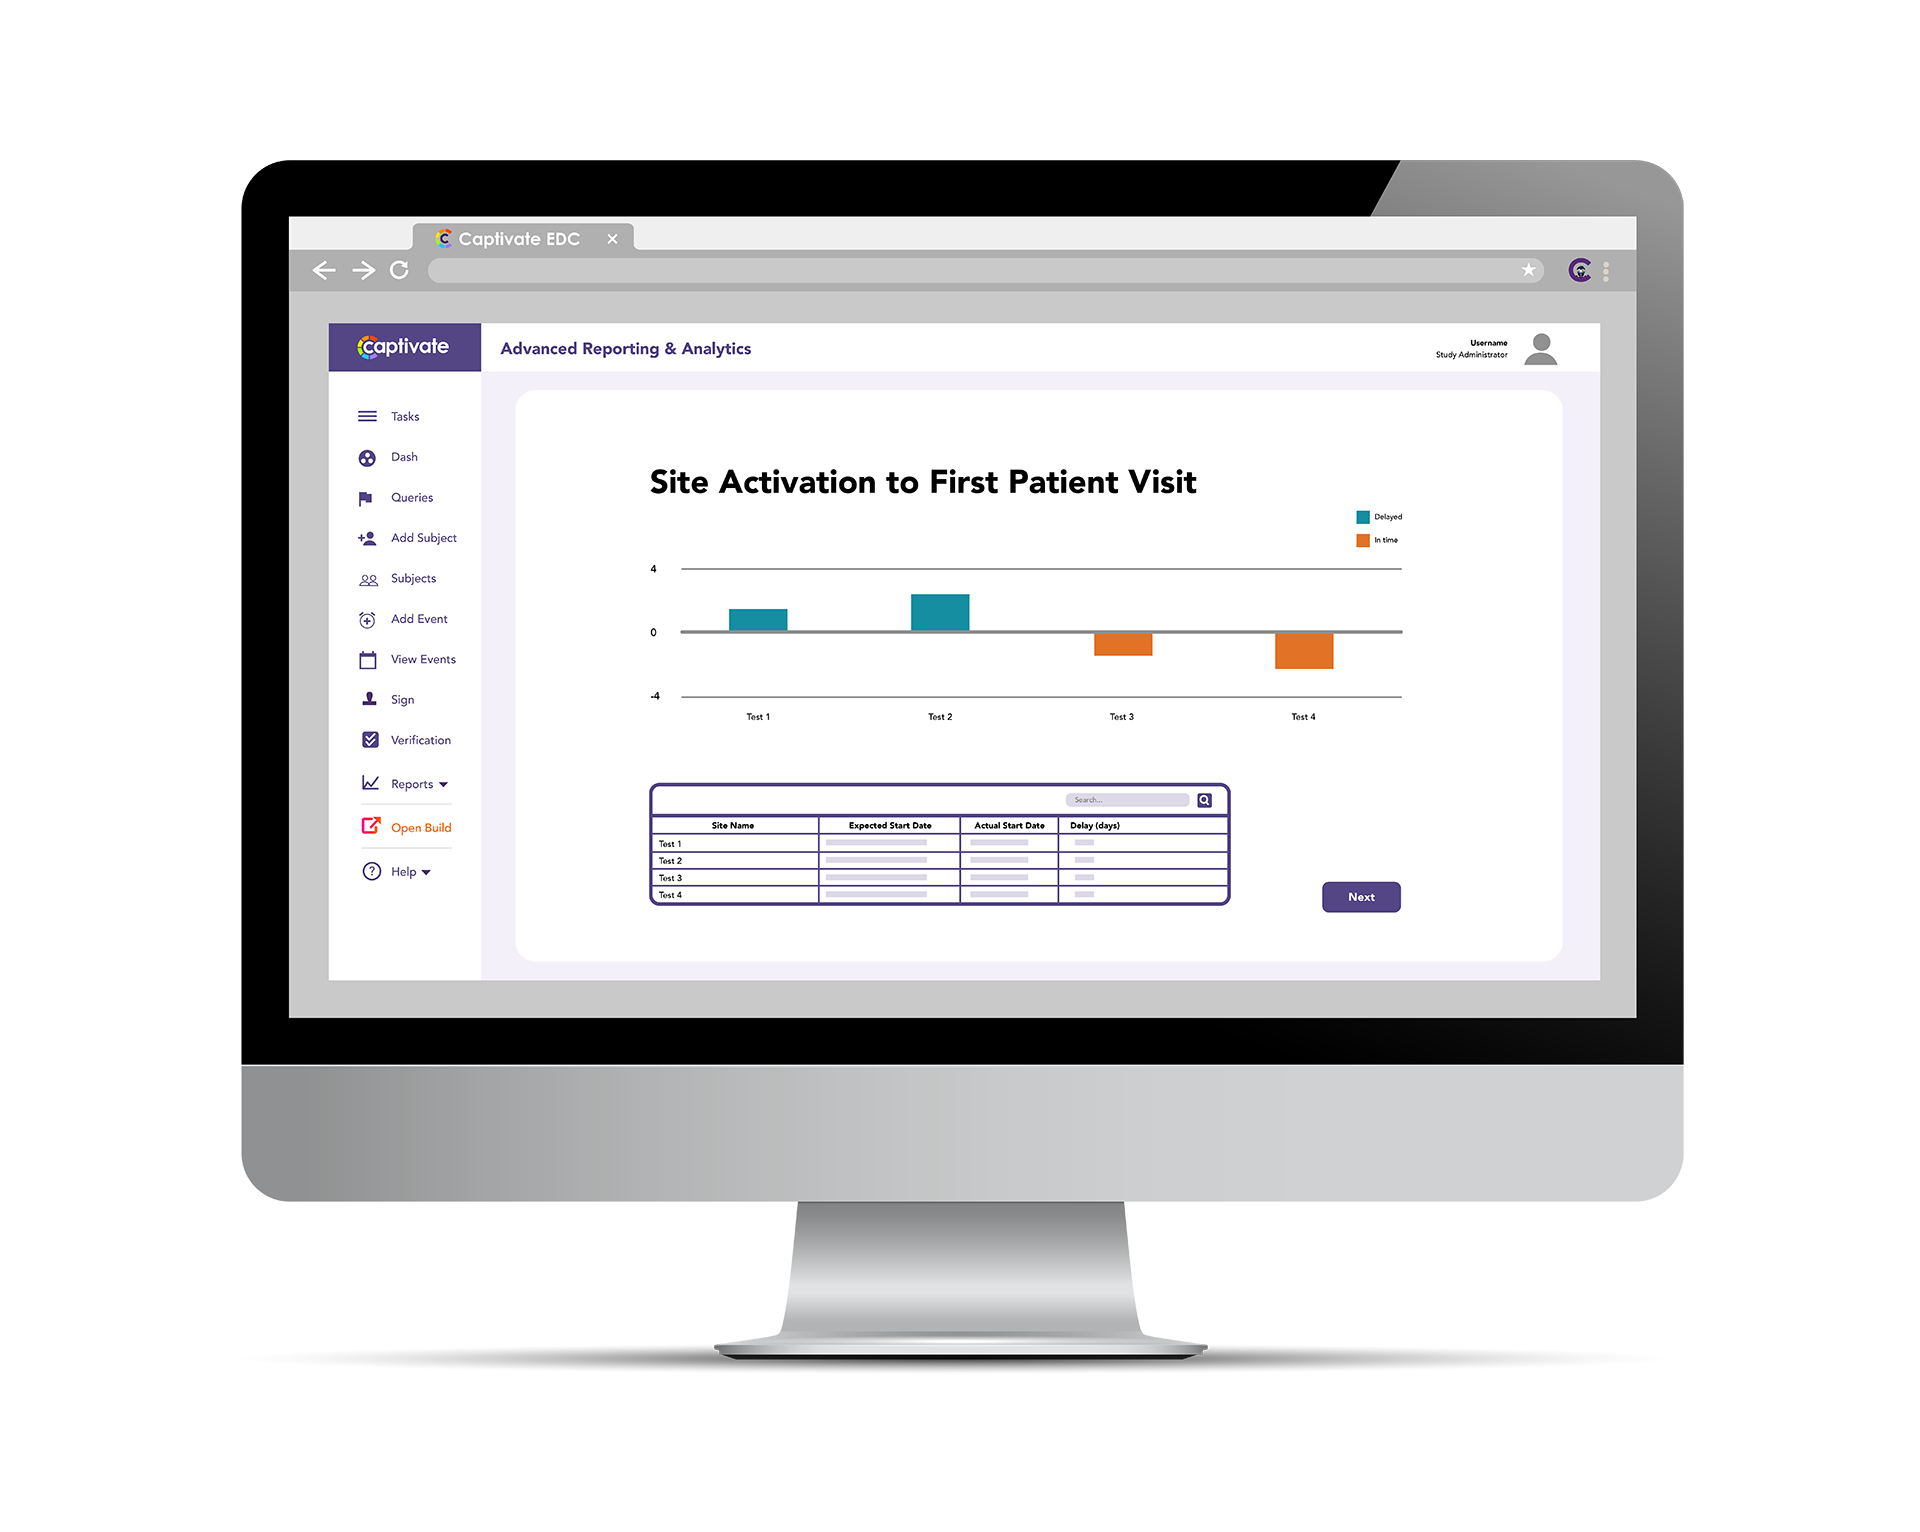
Site Performance
Site Activation to First Patient Visit- Compare site performance by measuring subject enrollment
- View site data on one report
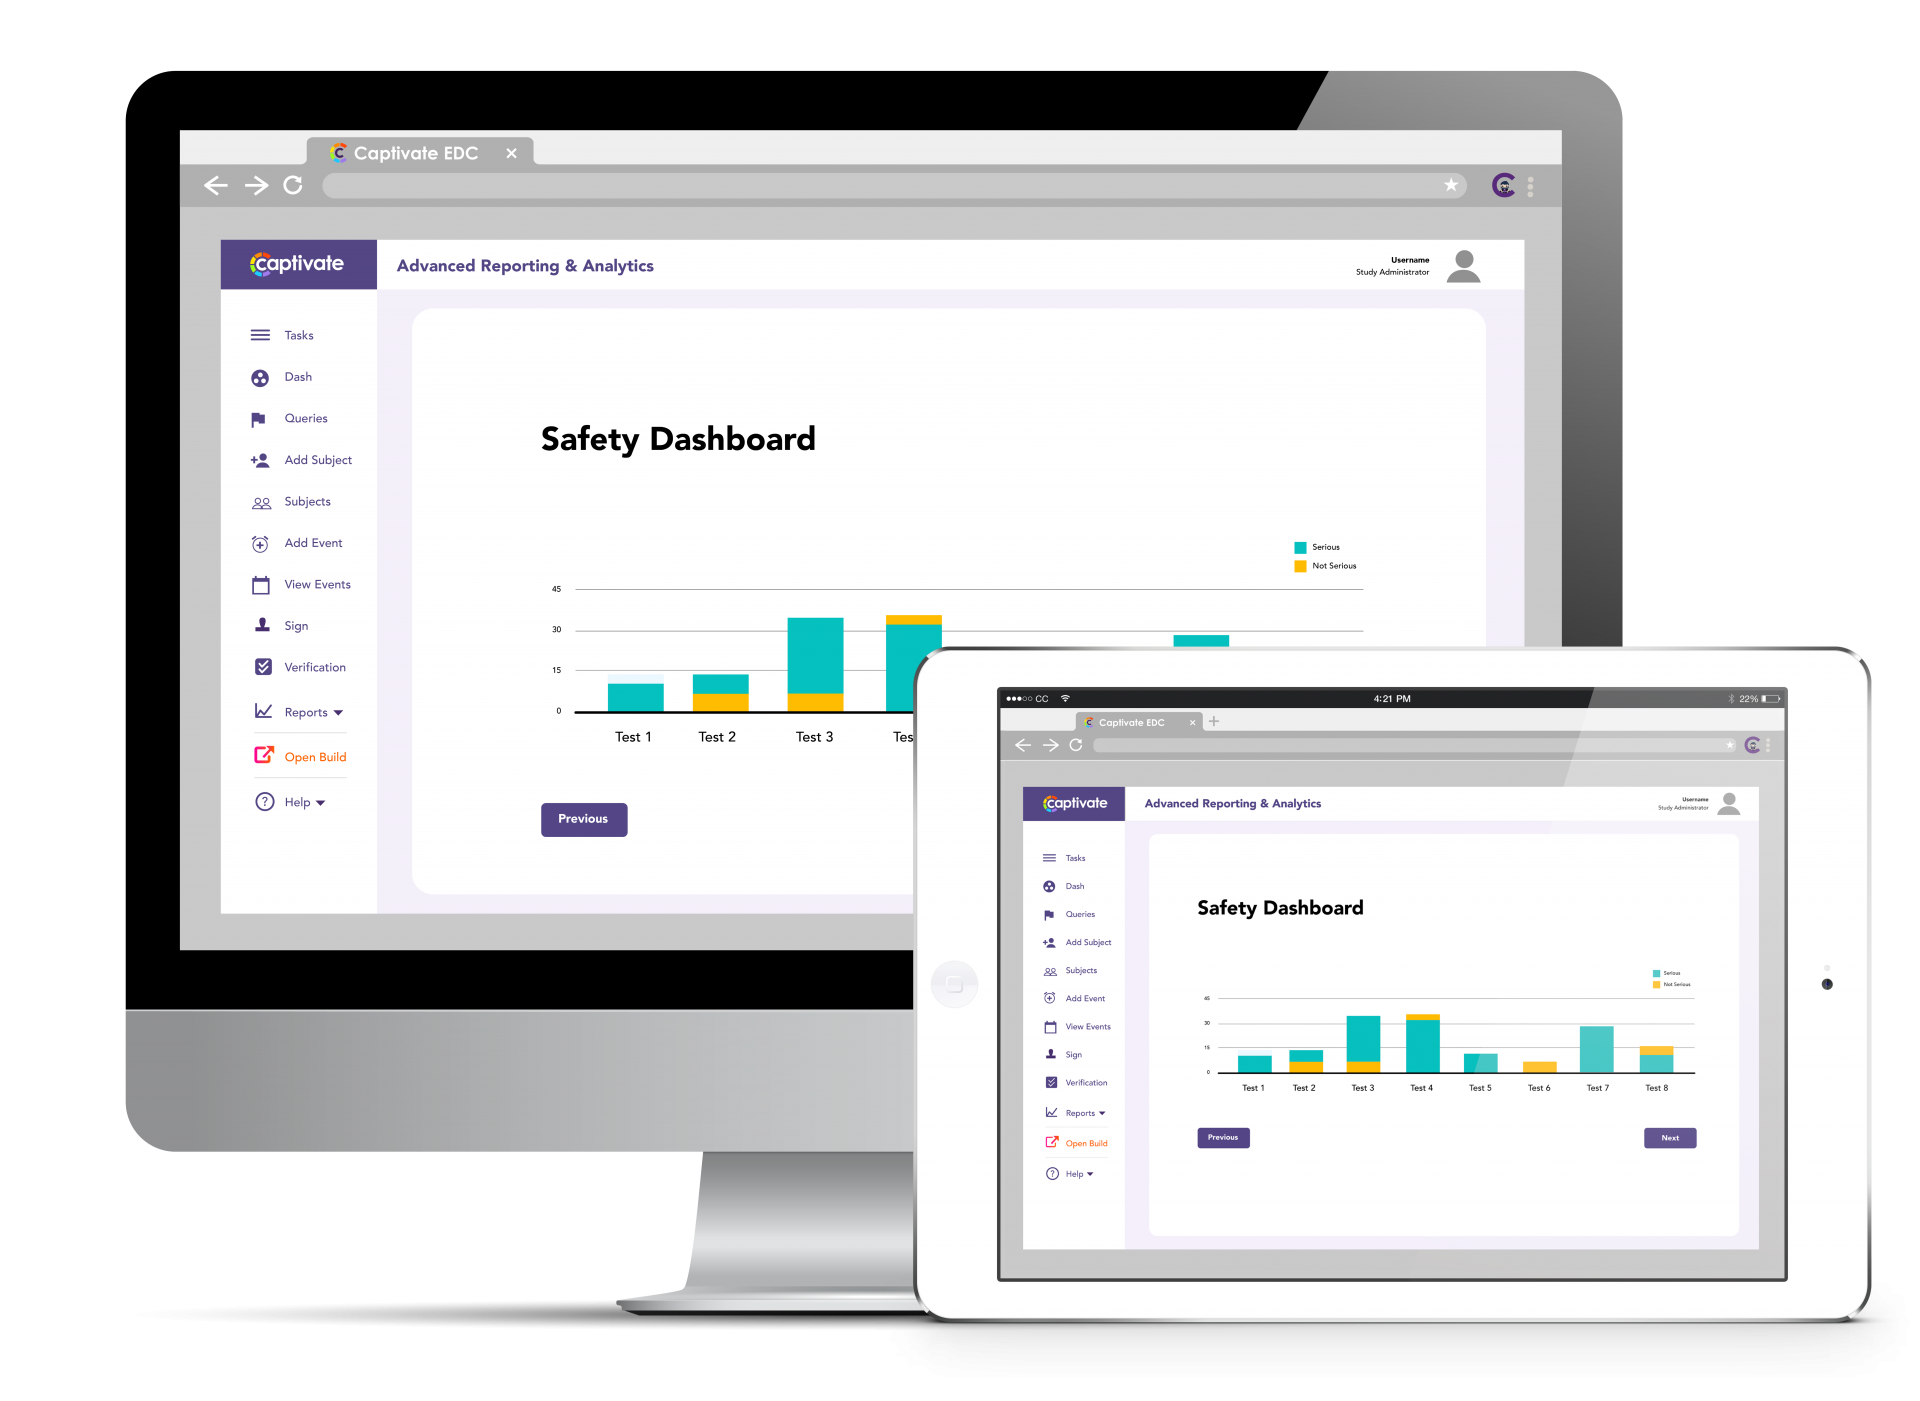
Safety
Safety Dashboard- Review safety metrics including adverse event rate, serious adverse event rate, related serious adverse event rate, death rate and related death rate
- Compare data across sites